Adding labels to a ggplot can be a nice way to display summary statistics and complement a visualization. But positioning these can be annoying.
This post is about how I take advantage of ggplot2’s positioning of inifinity, to make labels always “float” at the edge of plots. This is similar to the concept of floating elements in web design.
Doing it with a demo
library(tidyverse)

group_stats <- iris %>%
  group_by(Species) %>%
  summarise(lab = mean(Sepal.Length))

ggplot(iris, aes(x = Species, y = Sepal.Length)) +
  geom_point(alpha = .25) +
  geom_label(data = group_stats, aes(label = lab, y = Inf), vjust = 1)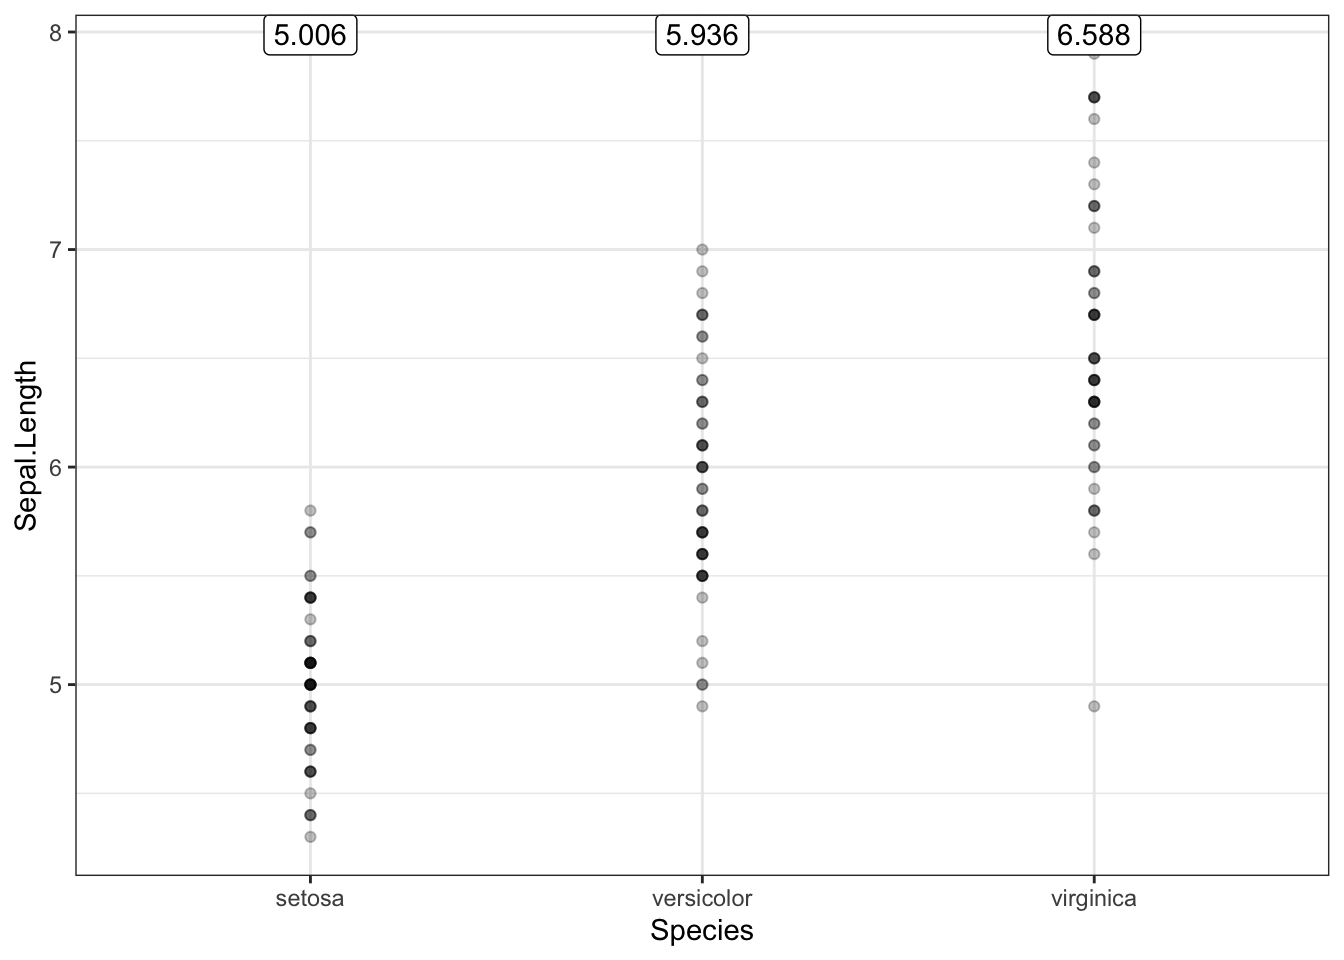
The secret sauce is pairing x/y = Inf and vjust = 1.
You can use -Inf the same way with vjust = 0.
ggplot(iris, aes(x = Species, y = Sepal.Length)) +
  geom_point(alpha = .25) +
  geom_label(data = group_stats, aes(label = lab, y = -Inf), vjust = 0)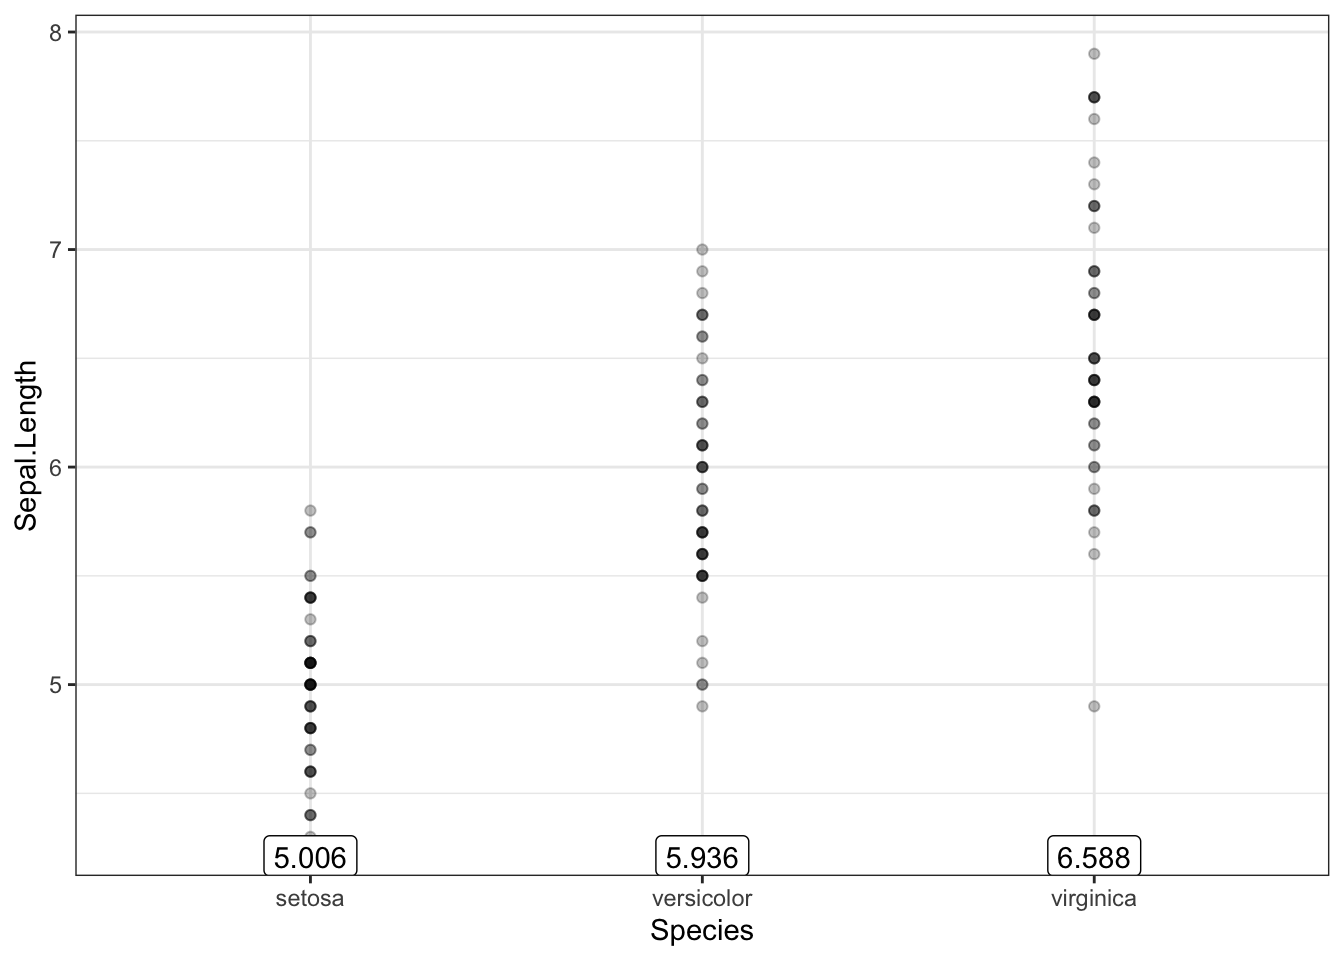
If you use a value outside of 0:1, you can continue moving the text further away from the edges, but these are the combinations to keep the labels always touching the edge.
If you accidentally use the wrong direction of vjust, you can actually push your labels beyond the edges of the plotting area, causing them to disappear. Notice no warning is raised.
ggplot(iris, aes(x = Species, y = Sepal.Length)) +
  geom_point(alpha = .25) +
  geom_label(data = group_stats, aes(label = lab, y = Inf), vjust = -1)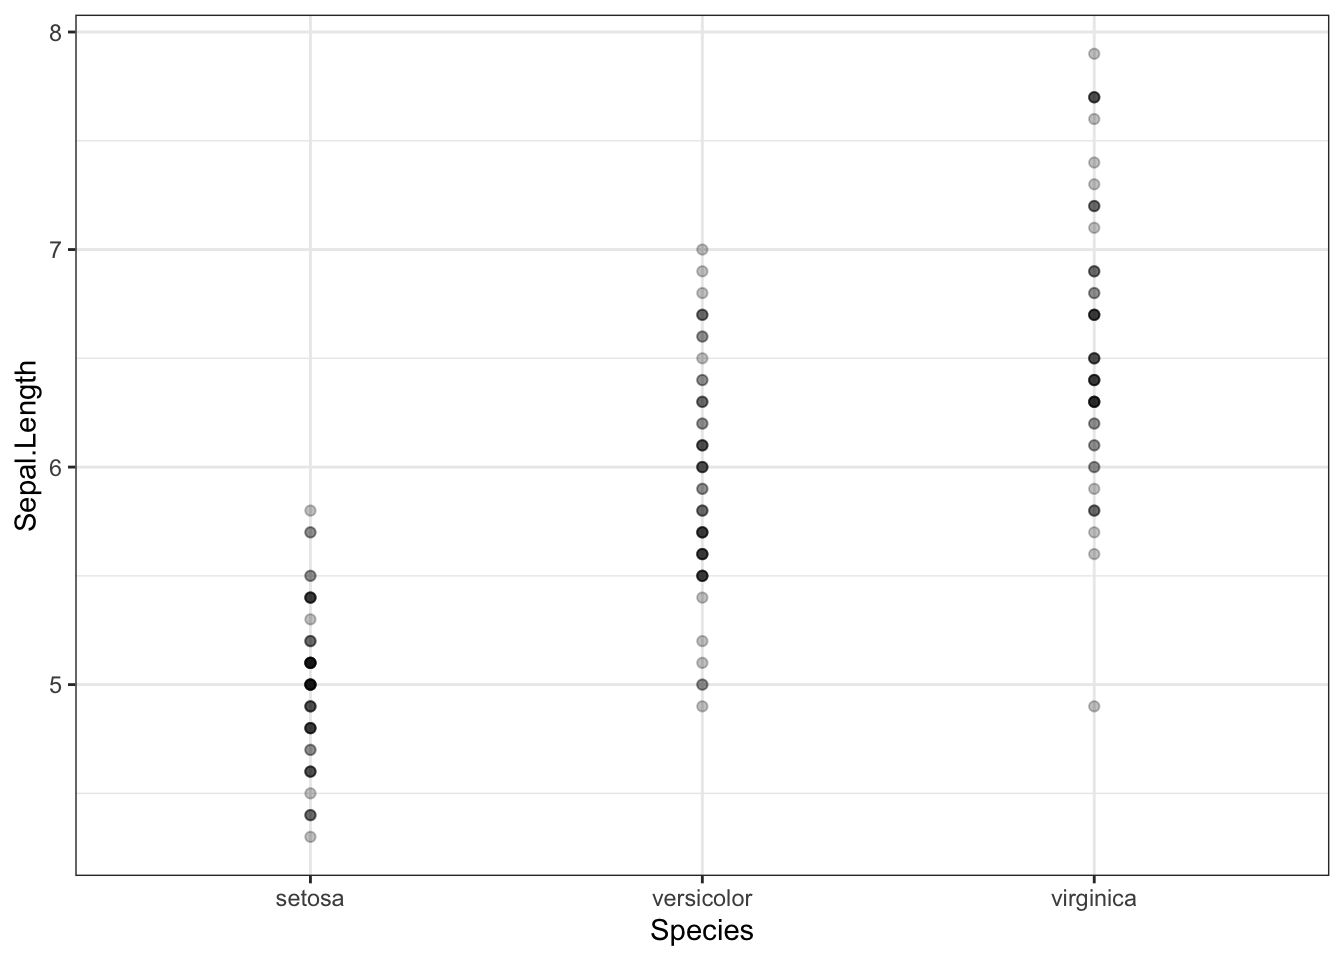
Preventing labels from hiding the data
In the second plot, where I used -Inf, my labels actually covered up the lowest data point for setosa. This can become a bigger problem in facetted plots when the labels consume more of the plotting area and the panelled variables cover different ranges.
Using all four measured variables of iris for a demonstration.
iris_long <- gather(iris, "key", "value", - Species)

group_stats2 <- iris_long %>%
  group_by(Species, key) %>%
  summarise(lab = mean(value))

ggplot(iris_long, aes(x = Species, y = value)) +
  geom_point(alpha = .25) +
  geom_label(data = group_stats2, aes(label = lab, y = -Inf), vjust = 0) +
  facet_wrap(~key, scales = "free_y")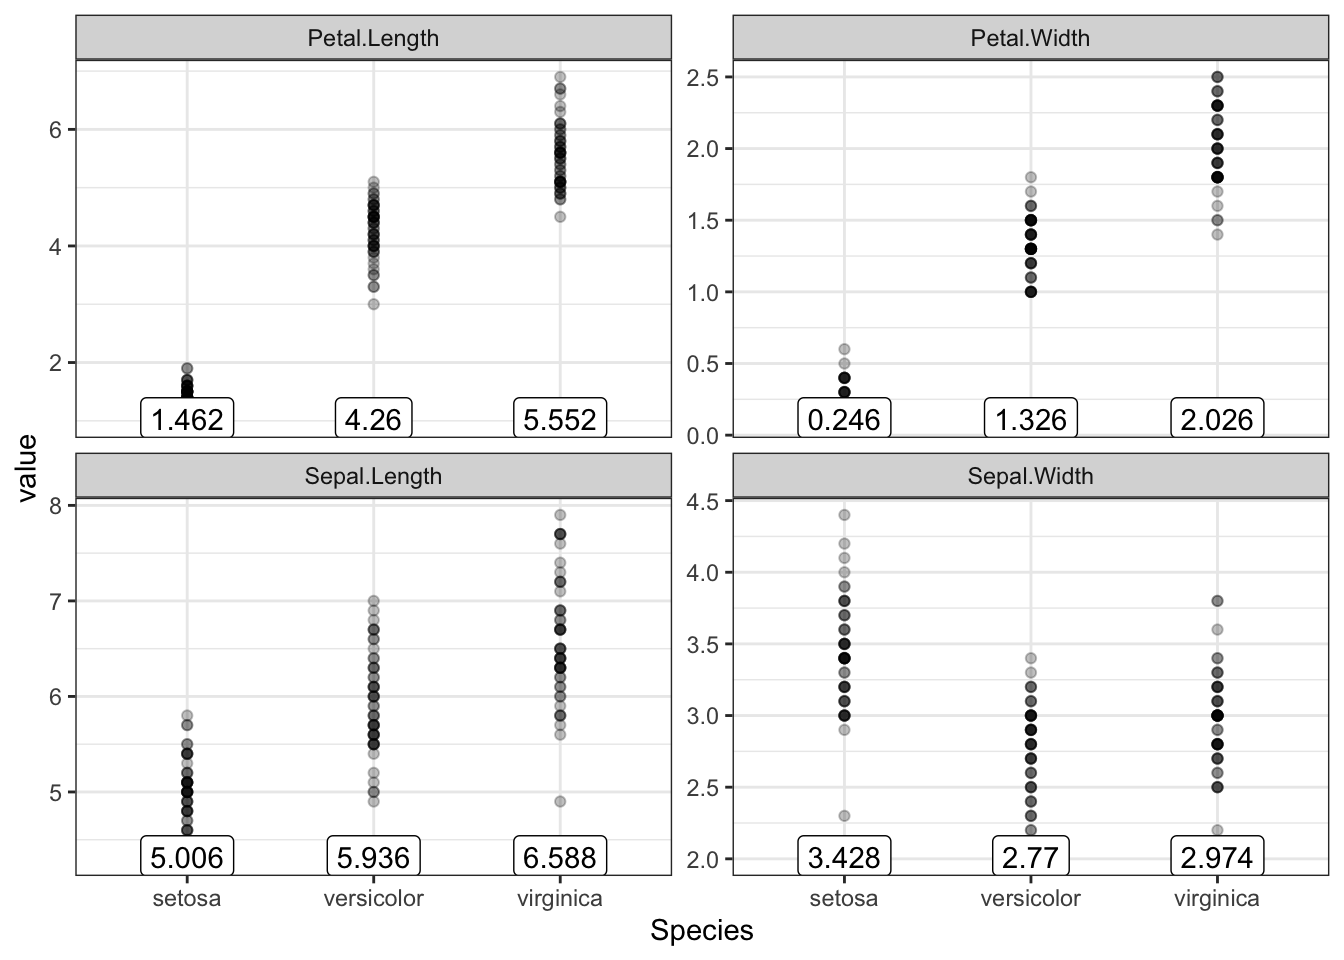
To prevent this I adjust ggplot’s default axis expansion margins.
ggplot(iris_long, aes(x = Species, y = value)) +
  geom_point(alpha = .25) +
  geom_label(data = group_stats2, aes(label = lab, y = -Inf), vjust = 0) +
  scale_y_continuous(expand = c(.25, .05)) + # default is c(.05, .05)
  facet_wrap(~key, scales = "free_y")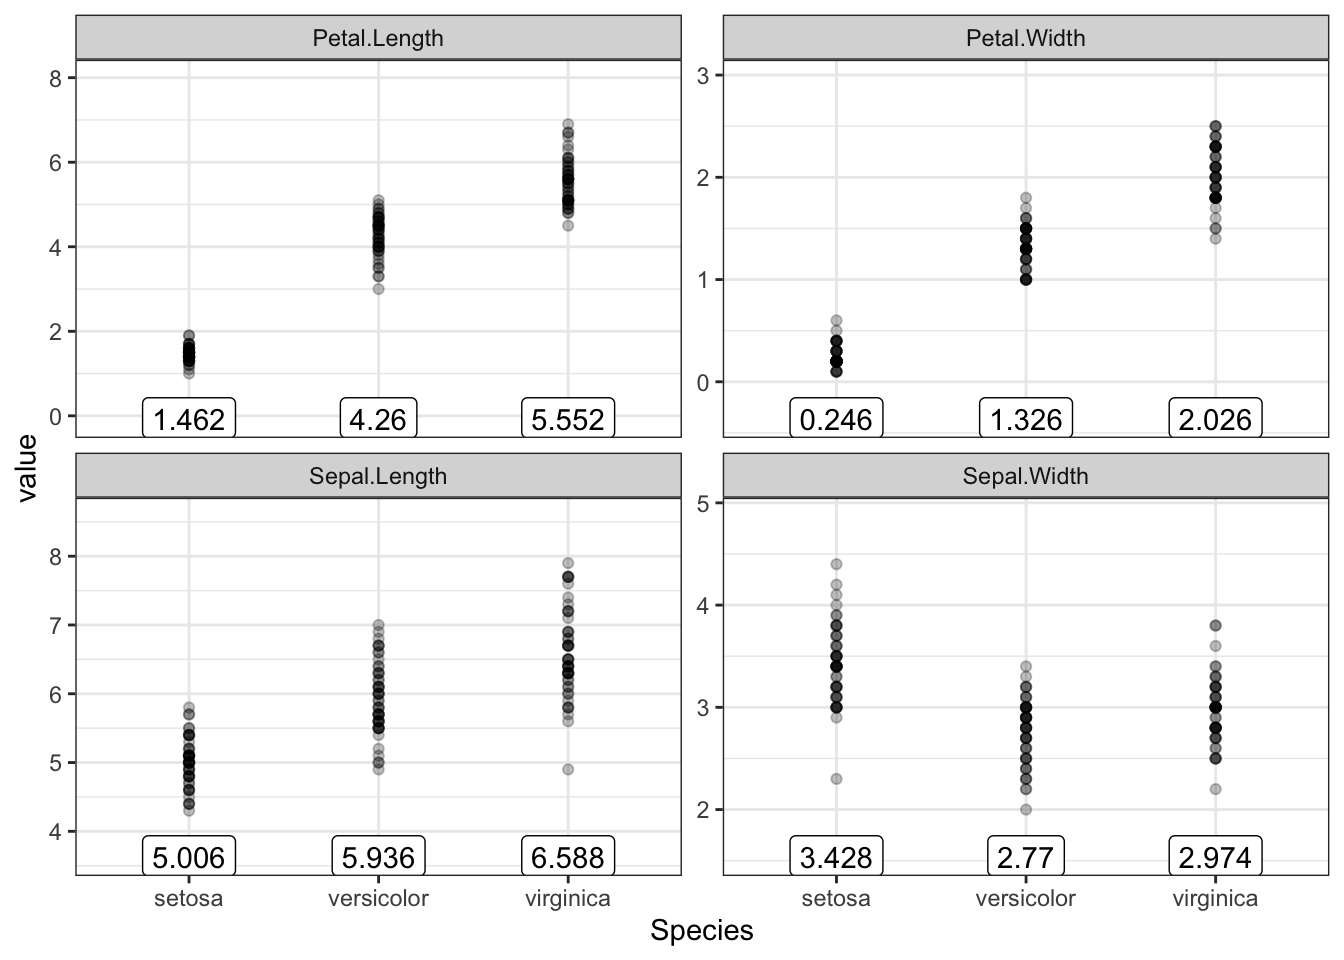
The vector being passed to expand = extends the axis limits by 20% from the lowest value and 5% from the uppermost. For continuous variables the default is to expand 5% on each side, to ensure a no geoms are plotted too close to the edge.
And now you know how to nicely float labels in your ggplot’s! What you put in those labels us up to you. I often use labels for percentage change and/or p-values, adjusting for multiple comparrisons of course :)
devtools::session_info()## ─ Session info ───────────────────────────────────────────────────────────────
## setting value
## version R version 3.6.2 (2019-12-12)
## os macOS Catalina 10.15.5
## system x86_64, darwin15.6.0
## ui X11
## language (EN)
## collate en_US.UTF-8
## ctype en_US.UTF-8
## tz America/New_York
## date 2020-06-10
##
## ─ Packages ───────────────────────────────────────────────────────────────────
## ! package * version date lib source
## P assertthat 0.2.1 2019-03-21 [?] CRAN (R 3.6.0)
## P backports 1.1.5 2019-10-02 [?] CRAN (R 3.6.0)
## P blogdown 0.17 2019-11-13 [?] CRAN (R 3.6.0)
## P bookdown 0.15 2019-11-12 [?] CRAN (R 3.6.0)
## P broom 0.5.2 2019-04-07 [?] CRAN (R 3.6.0)
## P callr 3.3.2 2019-09-22 [?] CRAN (R 3.6.0)
## P cellranger 1.1.0 2016-07-27 [?] CRAN (R 3.6.0)
## cli 2.0.2 2020-02-28 [1] CRAN (R 3.6.0)
## P colorspace 1.4-1 2019-03-18 [?] CRAN (R 3.6.0)
## P crayon 1.3.4 2017-09-16 [?] CRAN (R 3.6.0)
## P desc 1.2.0 2018-05-01 [?] CRAN (R 3.6.0)
## P devtools 2.2.1 2019-09-24 [?] CRAN (R 3.6.0)
## digest 0.6.25 2020-02-23 [1] CRAN (R 3.6.0)
## dplyr * 1.0.0 2020-05-29 [1] CRAN (R 3.6.2)
## ellipsis 0.3.1 2020-05-15 [1] CRAN (R 3.6.2)
## P evaluate 0.14 2019-05-28 [?] CRAN (R 3.6.0)
## fansi 0.4.1 2020-01-08 [1] CRAN (R 3.6.0)
## farver 2.0.3 2020-01-16 [1] CRAN (R 3.6.0)
## P forcats * 0.4.0 2019-02-17 [?] CRAN (R 3.6.0)
## P fs 1.3.1 2019-05-06 [?] CRAN (R 3.6.0)
## P generics 0.0.2 2018-11-29 [?] CRAN (R 3.6.0)
## P ggplot2 * 3.3.1 2020-05-28 [?] CRAN (R 3.6.2)
## glue 1.4.1 2020-05-13 [1] CRAN (R 3.6.2)
## P gtable 0.3.0 2019-03-25 [?] CRAN (R 3.6.0)
## P haven 2.2.0 2019-11-08 [?] CRAN (R 3.6.0)
## P hms 0.5.2 2019-10-30 [?] CRAN (R 3.6.0)
## P htmltools 0.4.0 2019-10-04 [?] CRAN (R 3.6.0)
## P httr 1.4.1 2019-08-05 [?] CRAN (R 3.6.0)
## jsonlite 1.6.1 2020-02-02 [1] CRAN (R 3.6.0)
## P knitr 1.26 2019-11-12 [?] CRAN (R 3.6.0)
## P labeling 0.3 2014-08-23 [?] CRAN (R 3.6.0)
## P lattice 0.20-38 2018-11-04 [?] CRAN (R 3.6.1)
## lifecycle 0.2.0 2020-03-06 [1] CRAN (R 3.6.0)
## P lubridate 1.7.4 2018-04-11 [?] CRAN (R 3.6.0)
## P magrittr 1.5 2014-11-22 [?] CRAN (R 3.6.0)
## P memoise 1.1.0 2017-04-21 [?] CRAN (R 3.6.0)
## P modelr 0.1.5 2019-08-08 [?] CRAN (R 3.6.0)
## P munsell 0.5.0 2018-06-12 [?] CRAN (R 3.6.0)
## P nlme 3.1-142 2019-11-07 [?] CRAN (R 3.6.0)
## pillar 1.4.4 2020-05-05 [1] CRAN (R 3.6.2)
## P pkgbuild 1.0.6 2019-10-09 [?] CRAN (R 3.6.0)
## P pkgconfig 2.0.3 2019-09-22 [?] CRAN (R 3.6.0)
## P pkgload 1.0.2 2018-10-29 [?] CRAN (R 3.6.0)
## P prettyunits 1.0.2 2015-07-13 [?] CRAN (R 3.6.0)
## P processx 3.4.1 2019-07-18 [?] CRAN (R 3.6.0)
## P ps 1.3.0 2018-12-21 [?] CRAN (R 3.6.0)
## purrr * 0.3.4 2020-04-17 [1] CRAN (R 3.6.2)
## P R6 2.4.1 2019-11-12 [?] CRAN (R 3.6.0)
## P Rcpp 1.0.3 2019-11-08 [?] CRAN (R 3.6.0)
## P readr * 1.3.1 2018-12-21 [?] CRAN (R 3.6.0)
## P readxl 1.3.1 2019-03-13 [?] CRAN (R 3.6.0)
## P remotes 2.1.0 2019-06-24 [?] CRAN (R 3.6.0)
## renv 0.8.3 2019-11-11 [1] CRAN (R 3.6.1)
## P rlang 0.4.6 2020-05-02 [?] CRAN (R 3.6.2)
## P rmarkdown 1.17 2019-11-13 [?] CRAN (R 3.6.0)
## P rprojroot 1.3-2 2018-01-03 [?] CRAN (R 3.6.0)
## P rstudioapi 0.10 2019-03-19 [?] CRAN (R 3.6.0)
## P rvest 0.3.5 2019-11-08 [?] CRAN (R 3.6.0)
## scales 1.1.1 2020-05-11 [1] CRAN (R 3.6.2)
## P sessioninfo 1.1.1 2018-11-05 [?] CRAN (R 3.6.0)
## P stringi 1.4.3 2019-03-12 [?] CRAN (R 3.6.0)
## P stringr * 1.4.0 2019-02-10 [?] CRAN (R 3.6.0)
## P testthat 2.3.0 2019-11-05 [?] CRAN (R 3.6.0)
## tibble * 3.0.1 2020-04-20 [1] CRAN (R 3.6.2)
## P tidyr * 1.0.0 2019-09-11 [?] CRAN (R 3.6.0)
## tidyselect 1.1.0 2020-05-11 [1] CRAN (R 3.6.2)
## P tidyverse * 1.2.1 2017-11-14 [?] CRAN (R 3.6.0)
## P usethis 1.5.1 2019-07-04 [?] CRAN (R 3.6.0)
## P vctrs 0.3.1 2020-06-05 [?] CRAN (R 3.6.2)
## P withr 2.1.2 2018-03-15 [?] CRAN (R 3.6.0)
## P xfun 0.11 2019-11-12 [?] CRAN (R 3.6.0)
## P xml2 1.2.2 2019-08-09 [?] CRAN (R 3.6.0)
## yaml 2.2.1 2020-02-01 [1] CRAN (R 3.6.0)
##
## [1] /Users/nathanday/ROS/new_site/renv/library/R-3.6/x86_64-apple-darwin15.6.0
## [2] /private/var/folders/7_/cvjz84n54vx7zv_pw3gmdqr00000gn/T/RtmpbExkhR/renv-system-library
##
## P ── Loaded and on-disk path mismatch.