Geocoded crime reports for Charlottesville Virginia
November 27, 2018 - 5 minutes
Civic Data packages sf tidyversecpdcrimedata
Is a R data package, with a geocoded version of the Charlottesville Police Department’s public Assistant Reports for the last five years.
To install the package from GitHub:
# remotes::install_github("nathancday/cpdcrimedata")
library(cpdcrimedata)

library(tidyverse) # for manipulation tools
The primary dataset is cpd_crime, the original report’s 9 columns (UpperCamel), plus 4 new ones (lower_snake) related to geocoding:
formatted_address- address used in the successful GoogleAPI querylat- lattitude value returnedlon- longitude value returnedloc_type- type of location returned
data(cpd_crime)

names(cpd_crime)
## [1] "RecordID" "Offense" "IncidentID"
## [4] "BlockNumber" "StreetName" "Agency"
## [7] "DateReported" "HourReported" "address"
## [10] "lat" "lon" "formatted_address"
## [13] "loc_type"map(cpd_crime, ~ table(.) %>% sort(decreasing = T) %>% head)## $RecordID
## .
## 1 2 3 4 5 6
## 1 1 1 1 1 1
##
## $Offense
## .
## Assault Simple Hit and Run
## 2536 2274
## Towed Vehicle Vandalism
## 2171 1806
## Larceny - All Other Assist Citizen - Mental/TDO/ECO
## 1791 1706
##
## $IncidentID
## .
## 201000073238 201300004647 201300005270 201300007575 201400000108 201400000504
## 1 1 1 1 1 1
##
## $BlockNumber
## .
## 100 200 600 700 500 800
## 3938 2467 2224 1847 1765 1749
##
## $StreetName
## .
## E MARKET ST W MAIN ST EMMET ST N E MAIN ST
## 1778 1286 1136 676
## JEFFERSON PARK AVE PROSPECT AVE
## 594 553
##
## $Agency
## CPD
## 29475
##
## $DateReported
## .
## 2016-01-22 2015-10-31 2016-09-24 2016-10-14 2017-10-16 2015-08-31
## 48 38 38 38 38 37
##
## $HourReported
## .
## 1600 1500 1400 1700 1100 1300
## 237 231 172 172 151 136
##
## $address
## .
## 600 E MARKET ST Charlottesville VA 700 PROSPECT AVE Charlottesville VA
## 1120 510
## 1100 5TH ST SW Charlottesville VA 800 HARDY DR Charlottesville VA
## 362 347
## 400 GARRETT ST Charlottesville VA 1100 EMMET ST N Charlottesville VA
## 310 309
##
## $lat
## .
## 38.0304127 38.0245896 38.0513687 38.01713 38.0334203 38.0279731
## 1153 510 379 363 347 310
##
## $lon
## .
## -78.4774586 -78.4946679 -78.5000734 -78.497806 -78.4902161 -78.4803241
## 1153 510 379 363 347 310
##
## $formatted_address
## .
## 600 E Market St, Charlottesville, VA 22902, USA
## 1156
## 700 Prospect Ave, Charlottesville, VA 22903, USA
## 510
## 1100 Emmet St N, Charlottesville, VA 22903, USA
## 379
## 1100 5th St SW, Charlottesville, VA 22902, USA
## 363
## 800 Hardy Dr, Charlottesville, VA 22903, USA
## 347
## 400 Garrett St, Charlottesville, VA 22902, USA
## 310
##
## $loc_type
## .
## RANGE_INTERPOLATED ROOFTOP GEOMETRIC_CENTER APPROXIMATE
## 16072 12897 442 11The original data is left untouched.
It has all of the orignal warts and wrinkles and you will likely need to a little extra data cleaning. The Offense column has a lot of variants for similar labels.
cpd_crime$Offense %>%
  keep(~ grepl("larceny", ., ignore.case = T)) %>%
  table()
## .
## Larceny - All Other Larceny - From Coin Oper Device
## 1791 8
## Larceny - From Motor Vehicle Larceny - Of Veh Parts/Access
## 1087 253
## Larceny - Pocket Picking Larceny - Purse Snatching
## 36 15
## Larceny - Shoplifitng Larceny - Theft from Building
## 684 712Making a plot
Let’s look at 6 most frequent offense labels we saw up above, with ggplot2.
library(tidyverse)

topn <- cpd_crime %>%
  mutate(Offense = fct_infreq(Offense)) %>%
  filter(Offense %in% levels(Offense)[1:6])
By design this dataset contains all of the records in the original, including records that were not able to be geocoded. Several addresses were geocoded as outside of the city limits and some are very far away!
To see the spatial distribution of police reports in the city, these “bad” records need to go. Here I’m using US Census maps from the CODP, as the geographic mask to keep only the locations in the city.
library(sf)

# get a census map of charlottesville
cville_census <- st_read("https://opendata.arcgis.com/datasets/63f965c73ddf46429befe1132f7f06e2_15.geojson") %>%
  select(Tract)
## Reading layer `7a85474e-f076-4514-8fb3-89d96a99ef8a202045-1-vqdn7z.lu9xc' from data source `https://opendata.arcgis.com/datasets/63f965c73ddf46429befe1132f7f06e2_15.geojson' using driver `GeoJSON'
## Simple feature collection with 12 features and 353 fields
## geometry type: POLYGON
## dimension: XY
## bbox: xmin: -78.52364 ymin: 38.00959 xmax: -78.44631 ymax: 38.0706
## CRS: 4326topn <- topn %>%
filter_at(vars(lat, lon), all_vars(!is.na(.))) %>%
st_as_sf(coords = c("lon", "lat"), crs = st_crs(cville_census)) %>%
st_join(cville_census, left = F)Now we can plot with ggplot2/sf. Since geom_sf() can be prohibitably slow with ~9000 data points, I’m using a work-around with stat_bin_2d.
# add the coordinates as a data frame s for ggplot()
topn <- st_coordinates(topn) %>%
  as_tibble() %>%
  setNames(c("lon","lat")) %>%
  bind_cols(topn)

# stat_bin() is a good alt geom
ggplot(cville_census) +
  geom_sf() +
  stat_density_2d(data = topn, aes(lon, lat, fill = stat(level)),
                  alpha = .5, geom = "polygon") +
  scale_fill_viridis_c(option = "A", name = "# reports") +
  coord_sf(datum = NA) +
  facet_wrap(~Offense) +
  theme_void()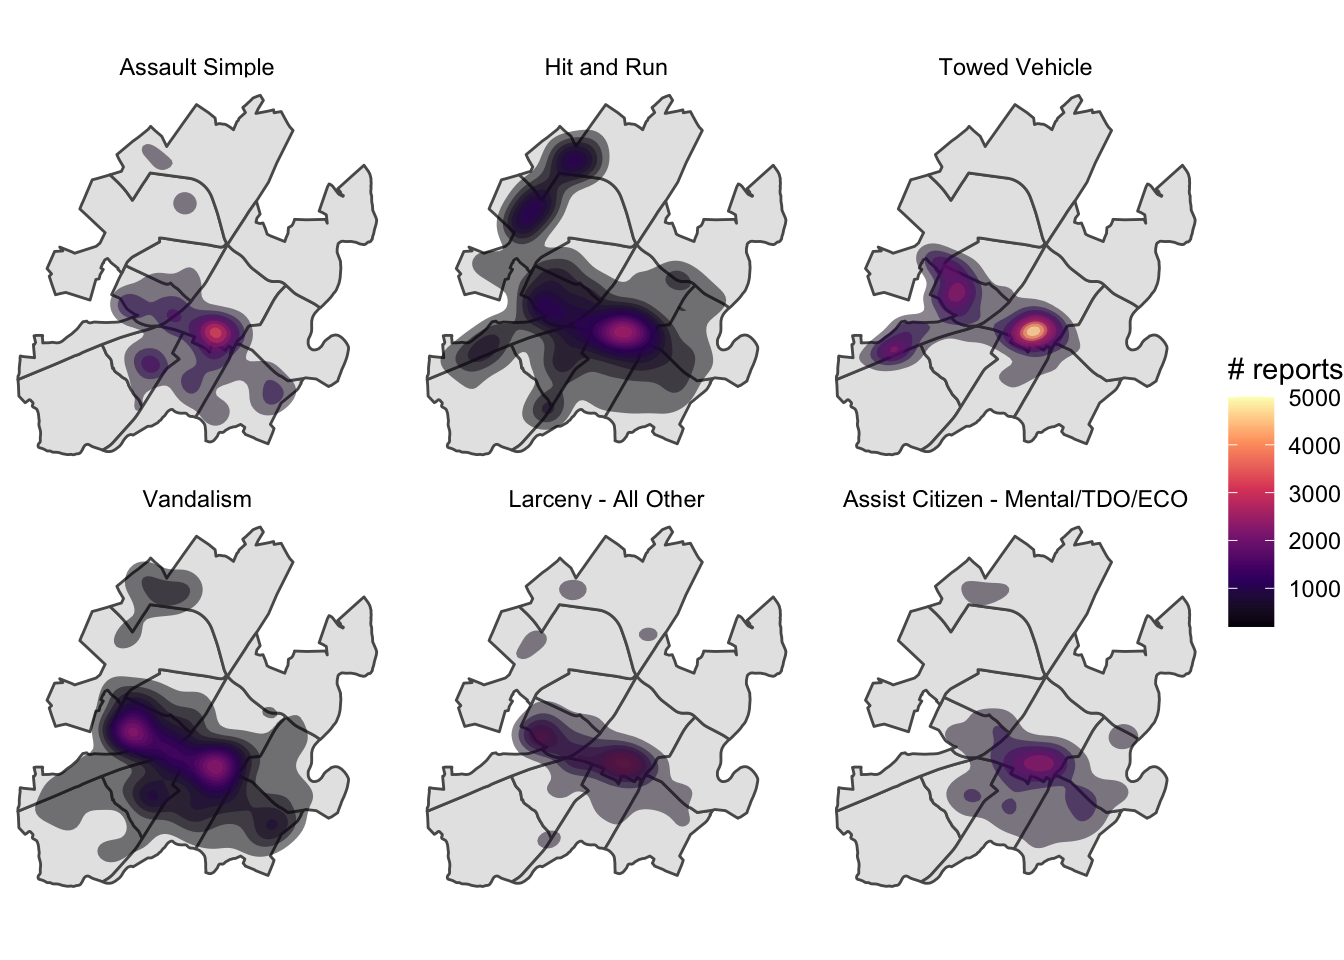
Going forward
Having this dataset as a R package is making my life easier. It was a good learning experiance for me to put this thing together and I pushed myself to get it set up on for CI with Travis! I’m looking forward to keeping this dataset
Intereseted in converting other Charlottesville data into R packages (possibly one big meta-package) to make civic data analysis with #rstats more accessible/shareable? If you have ideas for other local datasets that could benefit from a package tune-up, send me an email or open an issue